Third puzzle piece: Significant percentage movements.
Percentage movements are the third piece of our jigsaw puzzle and it is a very large piece indeed..
Gann's predetermined percentages calculated from past significant tops and bottoms will assist in identifying all future tops and bottoms. Experience warns that these levels should not be considered as definite buying and selling levels. They should be determined as 'Decision Levels' only that are then subject to the market itself recommending whether to buy, sell or hold. This conforms to the market maxim 'Let the market tell you what to do…don't tell the market what it should do.
At this point you may have concerns due to these two conflicting statements. Firstly we claimed that a past study will prove that all future highs and lows have a mathematical relationship with past highs and lows. We then stress that the calculated levels are only 'Decision Levels' subject to confirmation by the market itself. The reason for this final market confirmation is two fold.
1. We are all human with all the psychological problems and traits associated with speculative trading and investing. We are all, at some time of other, subject to the temptation to fit an analysis to suit our desires and aspirations. This strong desire to fit an analysis to suit traders hopes, fears and dreams can prove extremely dangerous especially for the emotional and inexperienced. Such emotional misjudgments can often be nullified by insisting that the market itself is the final arbitrator.
2. When using charts it is easy to overlook the analytical problems that are present without the benefit of hindsight as conveyed by the chart. To explain, when the calculated percentages line up and determine a 'Decision Level' this is the next level at which there is an expectation of a market turn. However in very strong or weak markets such levels may only halt the main trend fleetingly. By allowing the market itself to determine the action to take at the 'decision' level this often avoids the embarrassment of making an erroneous market entry. And now for the practical application of percentage moves from past highs and lows. To commence this analysis it is necessary to establish the order of importance of the different 'Percentage' moves from past highs and lows.
No 1 - The 50% moves
A - The most important percentage of all is a 50% move up or down from past tops and bottoms. For example the 50% move down from the historic high is of course our G1 level which is the most important level of all.
A1 - 50% moves up from lows are significant and often provide a future selling level.
A2 - 50% from a high, as well as the historic high, can often provide future lows.
A3 - There again 50% from a previous low can accurately provide the low for a future low.
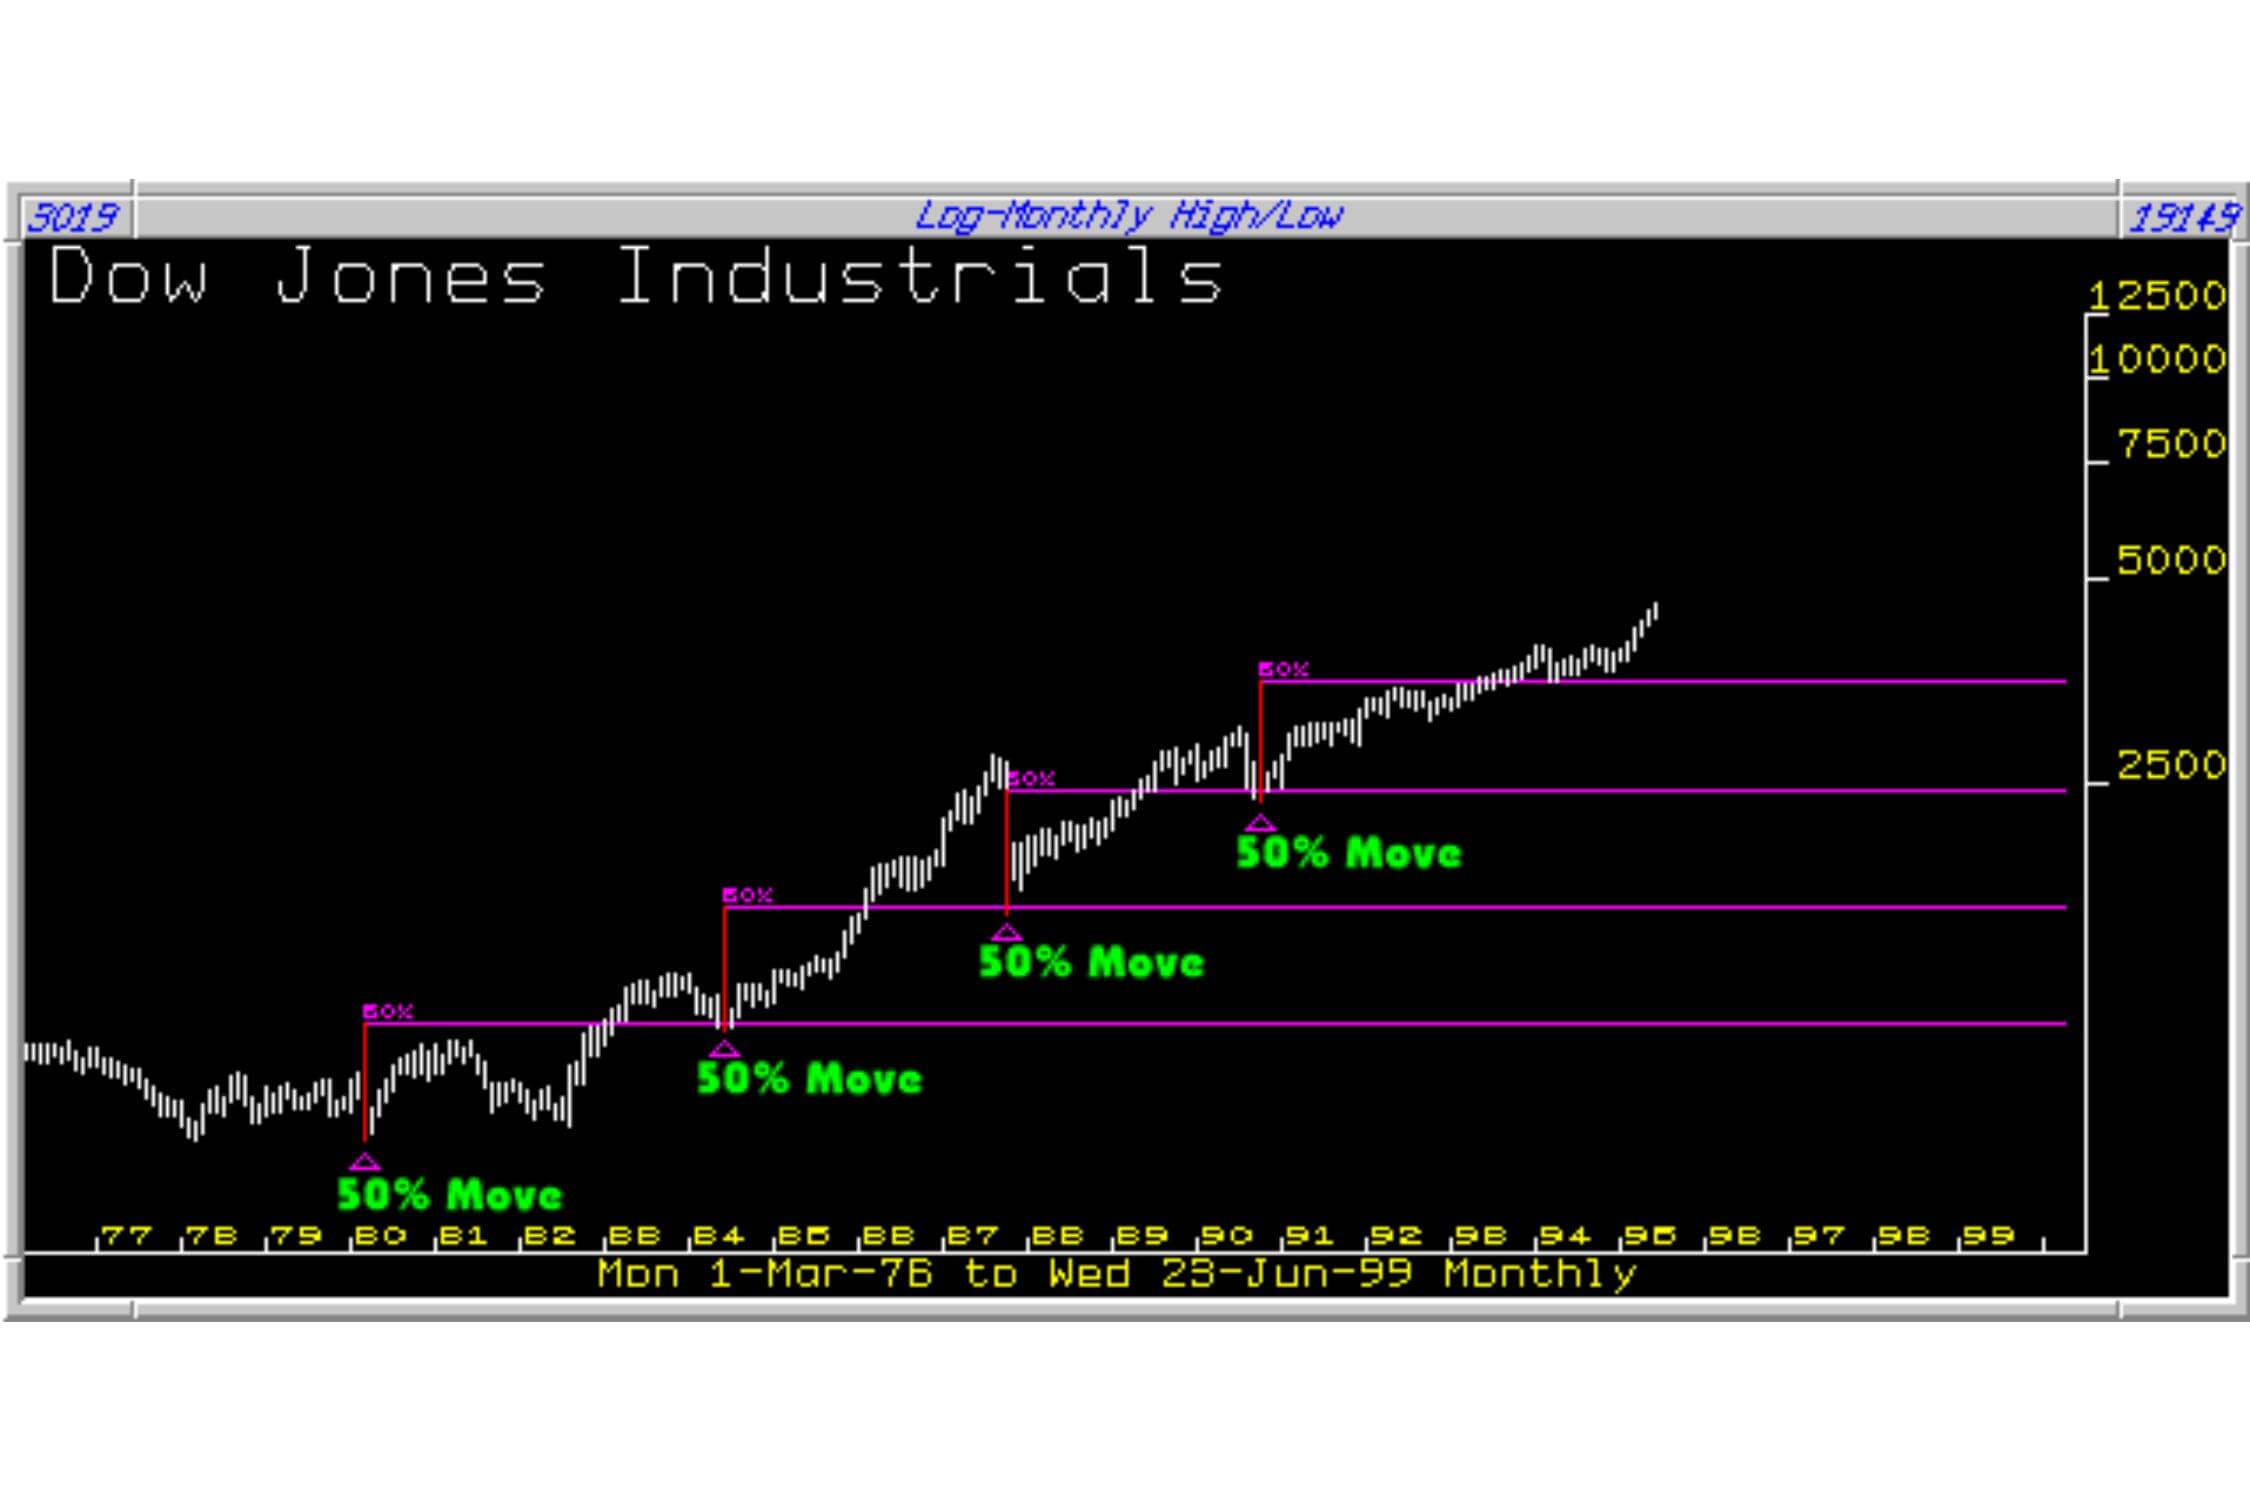
An outstanding example is the Dow Jones Index from the 1970's. This chart shows how extremely effective a 50% analysis can be.
(a) By adding 50% to the March 1980 low of 729 the projection is 1093. (The next major low in May 1984 was 1084…almost perfect.)
(b) By adding 50% to the May 1984 low at1084 the result is 1626. The next major low in October 1987 was 1616…almost perfect)
(c) By adding 50% to the October 1987 low at 1616 the result is 2424. The next major low in October 1990 was 2344…just a fraction out)
(d) By adding 50% to the October 1990 low at 2344 the projection is 4016. The next major low in April 1994 was 3520
No 2 - The 100%, 200%, 300% moves etc.
No 3 - The 33.33%, 66.66%, 133.33% etc
No 4 - The 16.66%, 8.33%, 4.165% etc.
No 5 - The 25%, 75%, 125% etc.
No 6 - The 12.5%, 37.5%, 62.5% etc
No 7 - The 6.25%, 18.75%
Formations at Percentages
Once the 'Decision' levels have been calculated and the price rises or falls to the 'Decision' level there are then three basic possibilities.
- 1 - Prices fall from the 'Decision' level
- 2 - Prices travel sideways and consolidate under the 'Decision' level.
- 3 - Prices rise or fall straight through the 'Decision' level.
In his research, my son, Gary, made some remarkable discoveries regarding future price movements after determining which of the three actions noted above took place. The rules introduce an extraordinary degree of certainty for moves following the determination of the action after prices hit a 'Decision' level. Details of these rules will be fully explained in Lesson 4.
Depending upon the type of action at the 'Decision' level the trader can be confident of the direction and exactitude of future prices with an extraordinary degree of certainty. In most instances it is quite magical in the way the rules unerringly determine future price movements.
Finding the Decision Levels
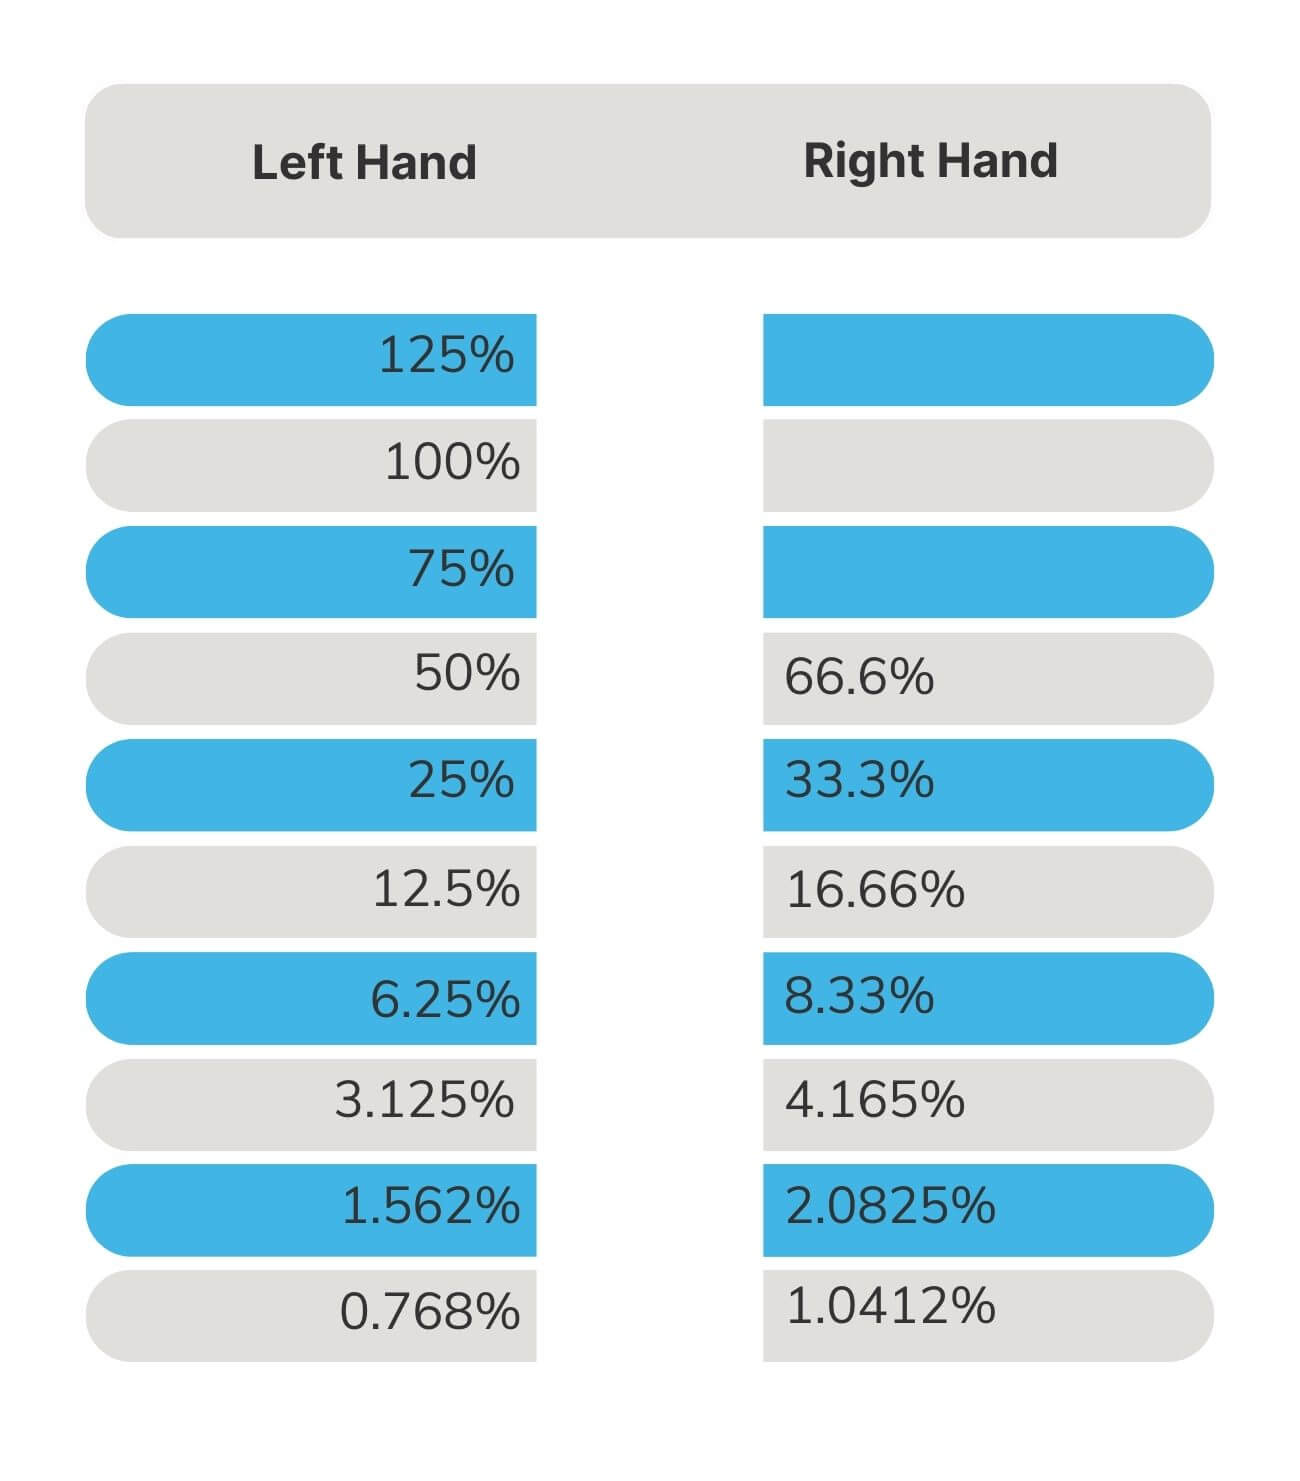
To continue note the following list of 'Percentages' making up what we term Left Hand and Right Hand Percentage columns.
Using 25% and 33.33% as the basic Gann percentages with each being added to each other to create the next higher percentage creates the table. Dividing 25% and 33.33% by 2 creates the lower percentages with each subsequent percentage being halved.
The percentages shown above will usually cover most market movements but the process can be taken to any extreme up or down.
Notes
1 -The paramount percentage is 50%.
2 -The next in order are 100%, 200%, 300% etc.
3 -The right-hand percentages carry twice the weight of importance of the left-hand percentages.
Applying Percentages
Firstly identify significant past highs and lows and then apply percentages up from lows and down from highs. When making a long-term assessment use a monthly chart. A medium-term assessment would be made on a weekly chart and a short-term assessment on a daily chart.
The objective is to find a number of percentages calculated from highs and lows which cluster together to form a future decision area. This would be particularly attractive if it also fell on one of the major G1, G2, G3 or G4 levels and even better if it fell on other Gann checks. When the level is identified take off all the immaterial calculations to leave an uncluttered chart. The best way to illustrate is by examples. Several examples follow.
Illustrations of Percentage Calculations
Here are some outstanding examples
A Long term Analysis
Way back in the early 1980's the writer anticipated the top of the Sterling rally in November 1980.This important top was isolated by using Percentage movements from important lows up from 1976 to 1980. This is a fine example illustrating how to establish a longer term decision level by the use of Gann pre-determined percentages from important lows.
Chart 1 : This chart contains the first percentage to be applied for a longer-term analysis. This is achieved by taking the initial low as soon as it becomes apparent and adding 50% to the value of the low. This is the first stab at a possible, but at this time an unlikely, future top.

Chart 2 : The second bottom has formed on this chart. The next percentage lower than 50% is then applied to the new lows, this being 33.33%. The result is disappointing, as the two calculations do not fall within the same area. We would really expect a much closer result than this. This first check therefore tells us nothing.

Chart 3 : Now we apply the next percentage lower then 33.33% i.e. 25% and have our first indication of a future top area. The 33.33% and the 25% land exactly together. Now take off the 50% and concentrate upon the other two calculations. Where levels are established early on they should only be considered as an 'area' rather than an exact decision level for the future. As we draw closer to our level the smaller percentages will eventually provide a more precise action level.

Chart 4 : The 16.66% level is now applied to the next low, which falls exactly in line with the previous two calculations. Things are now getting more than interesting.

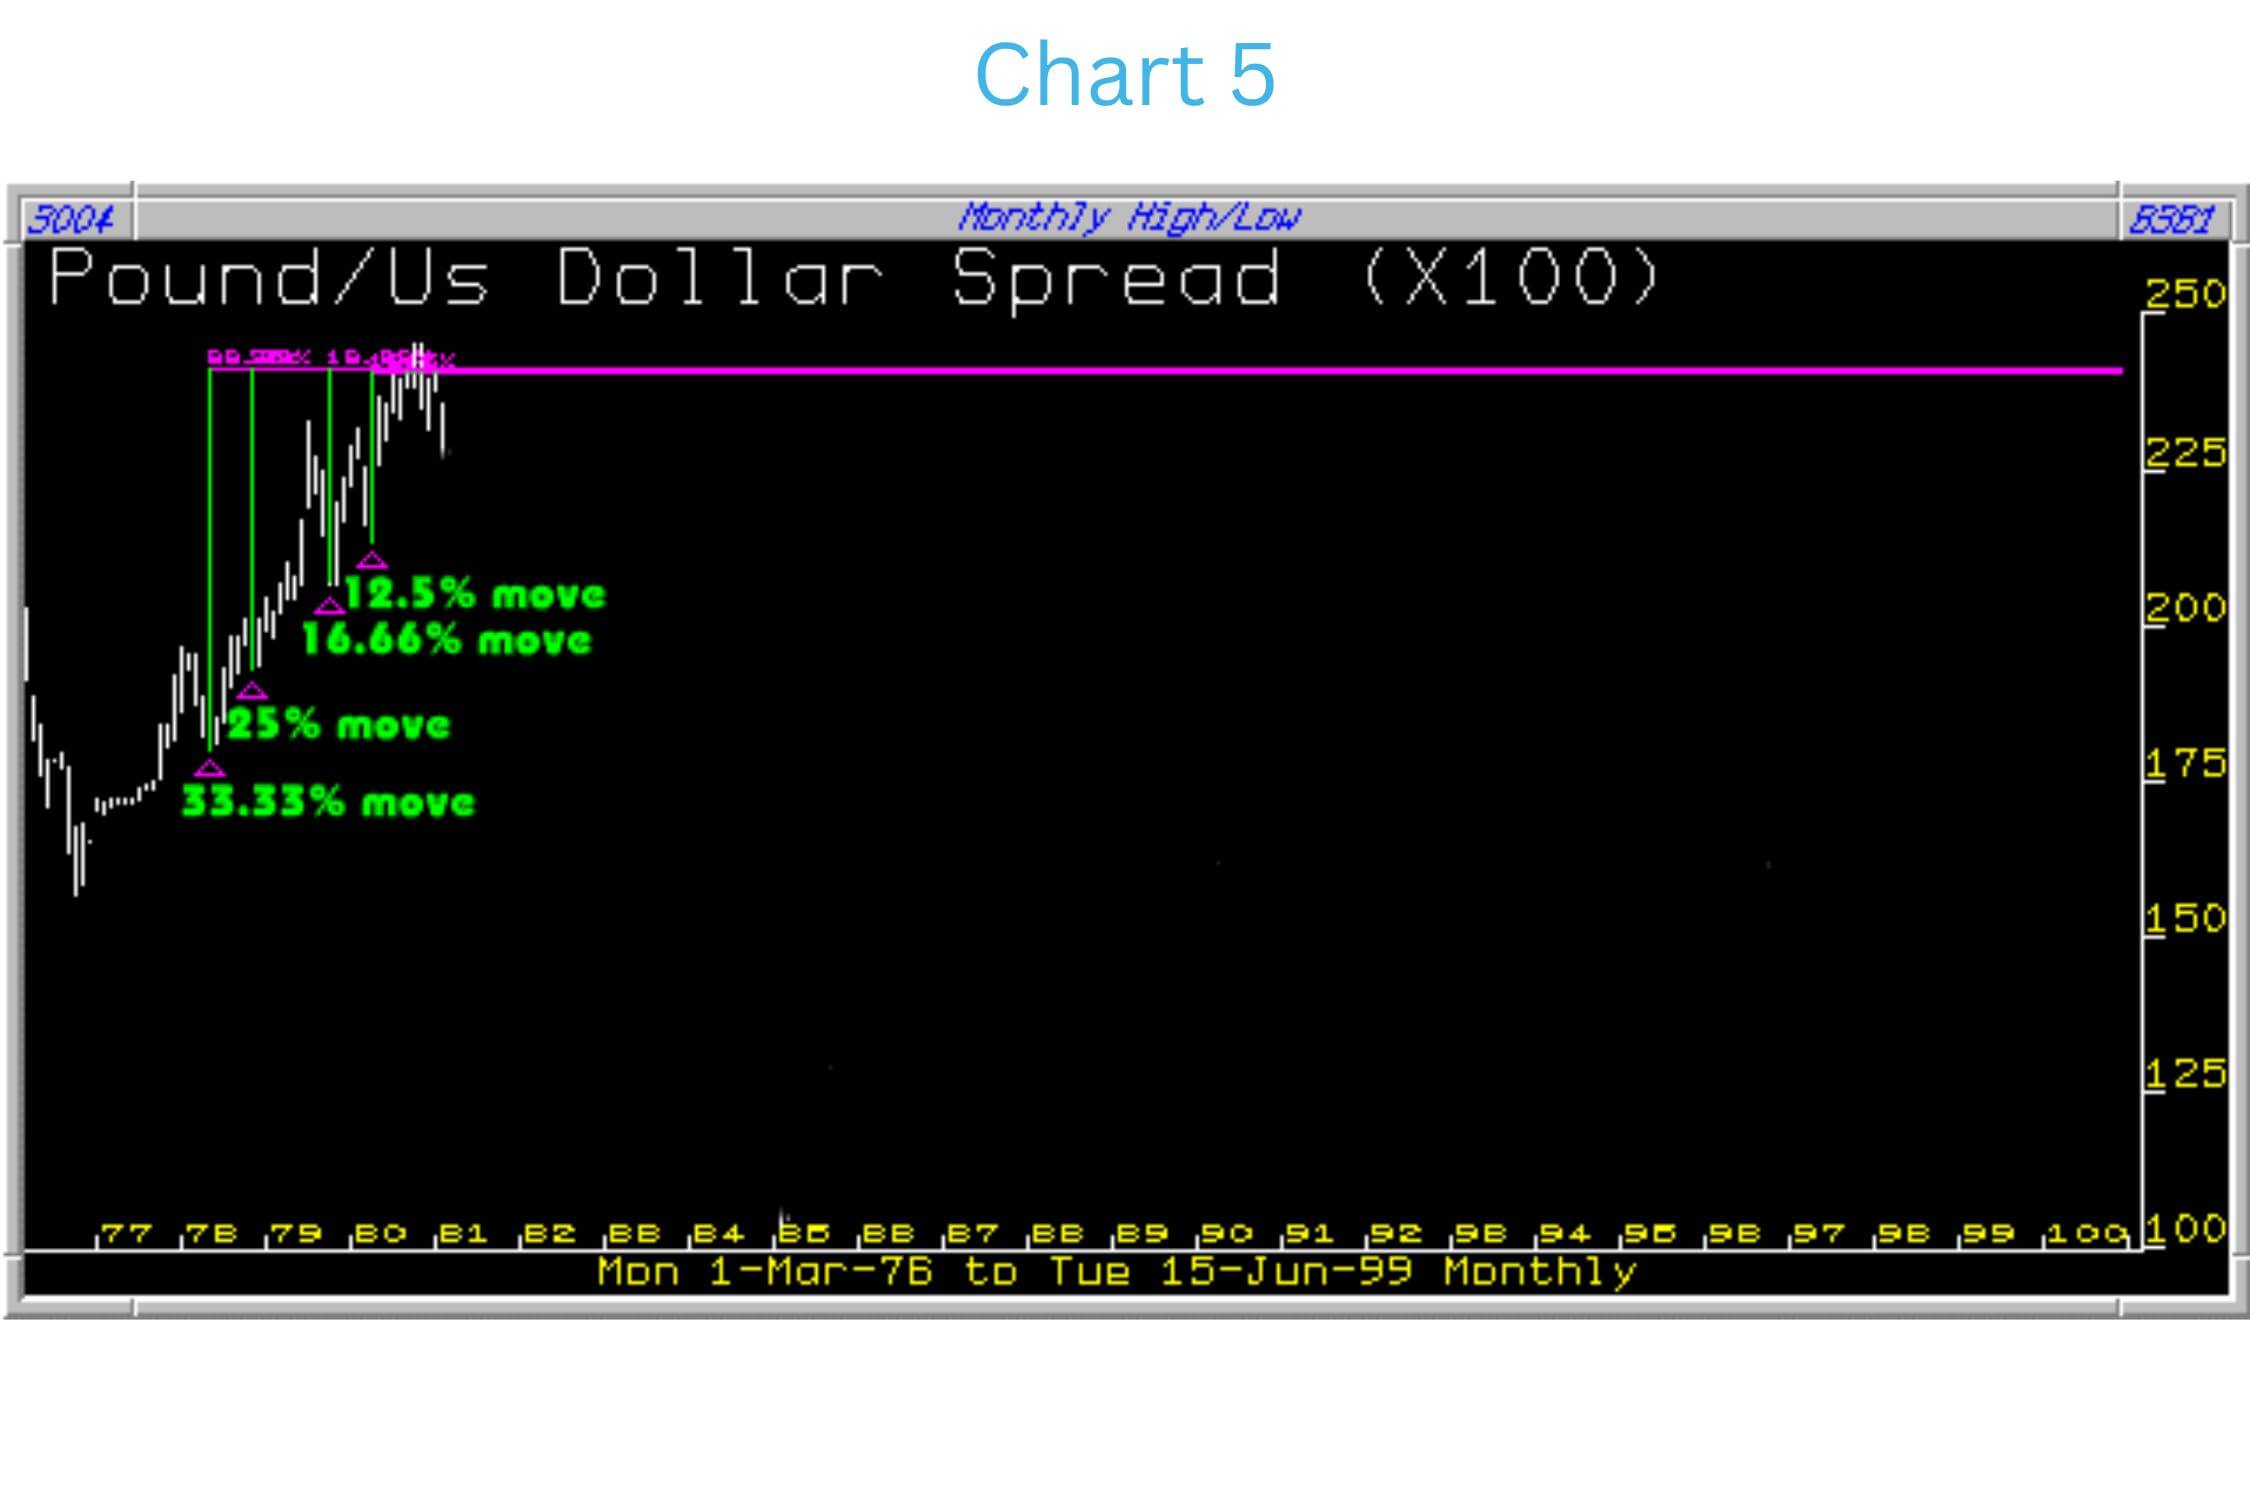
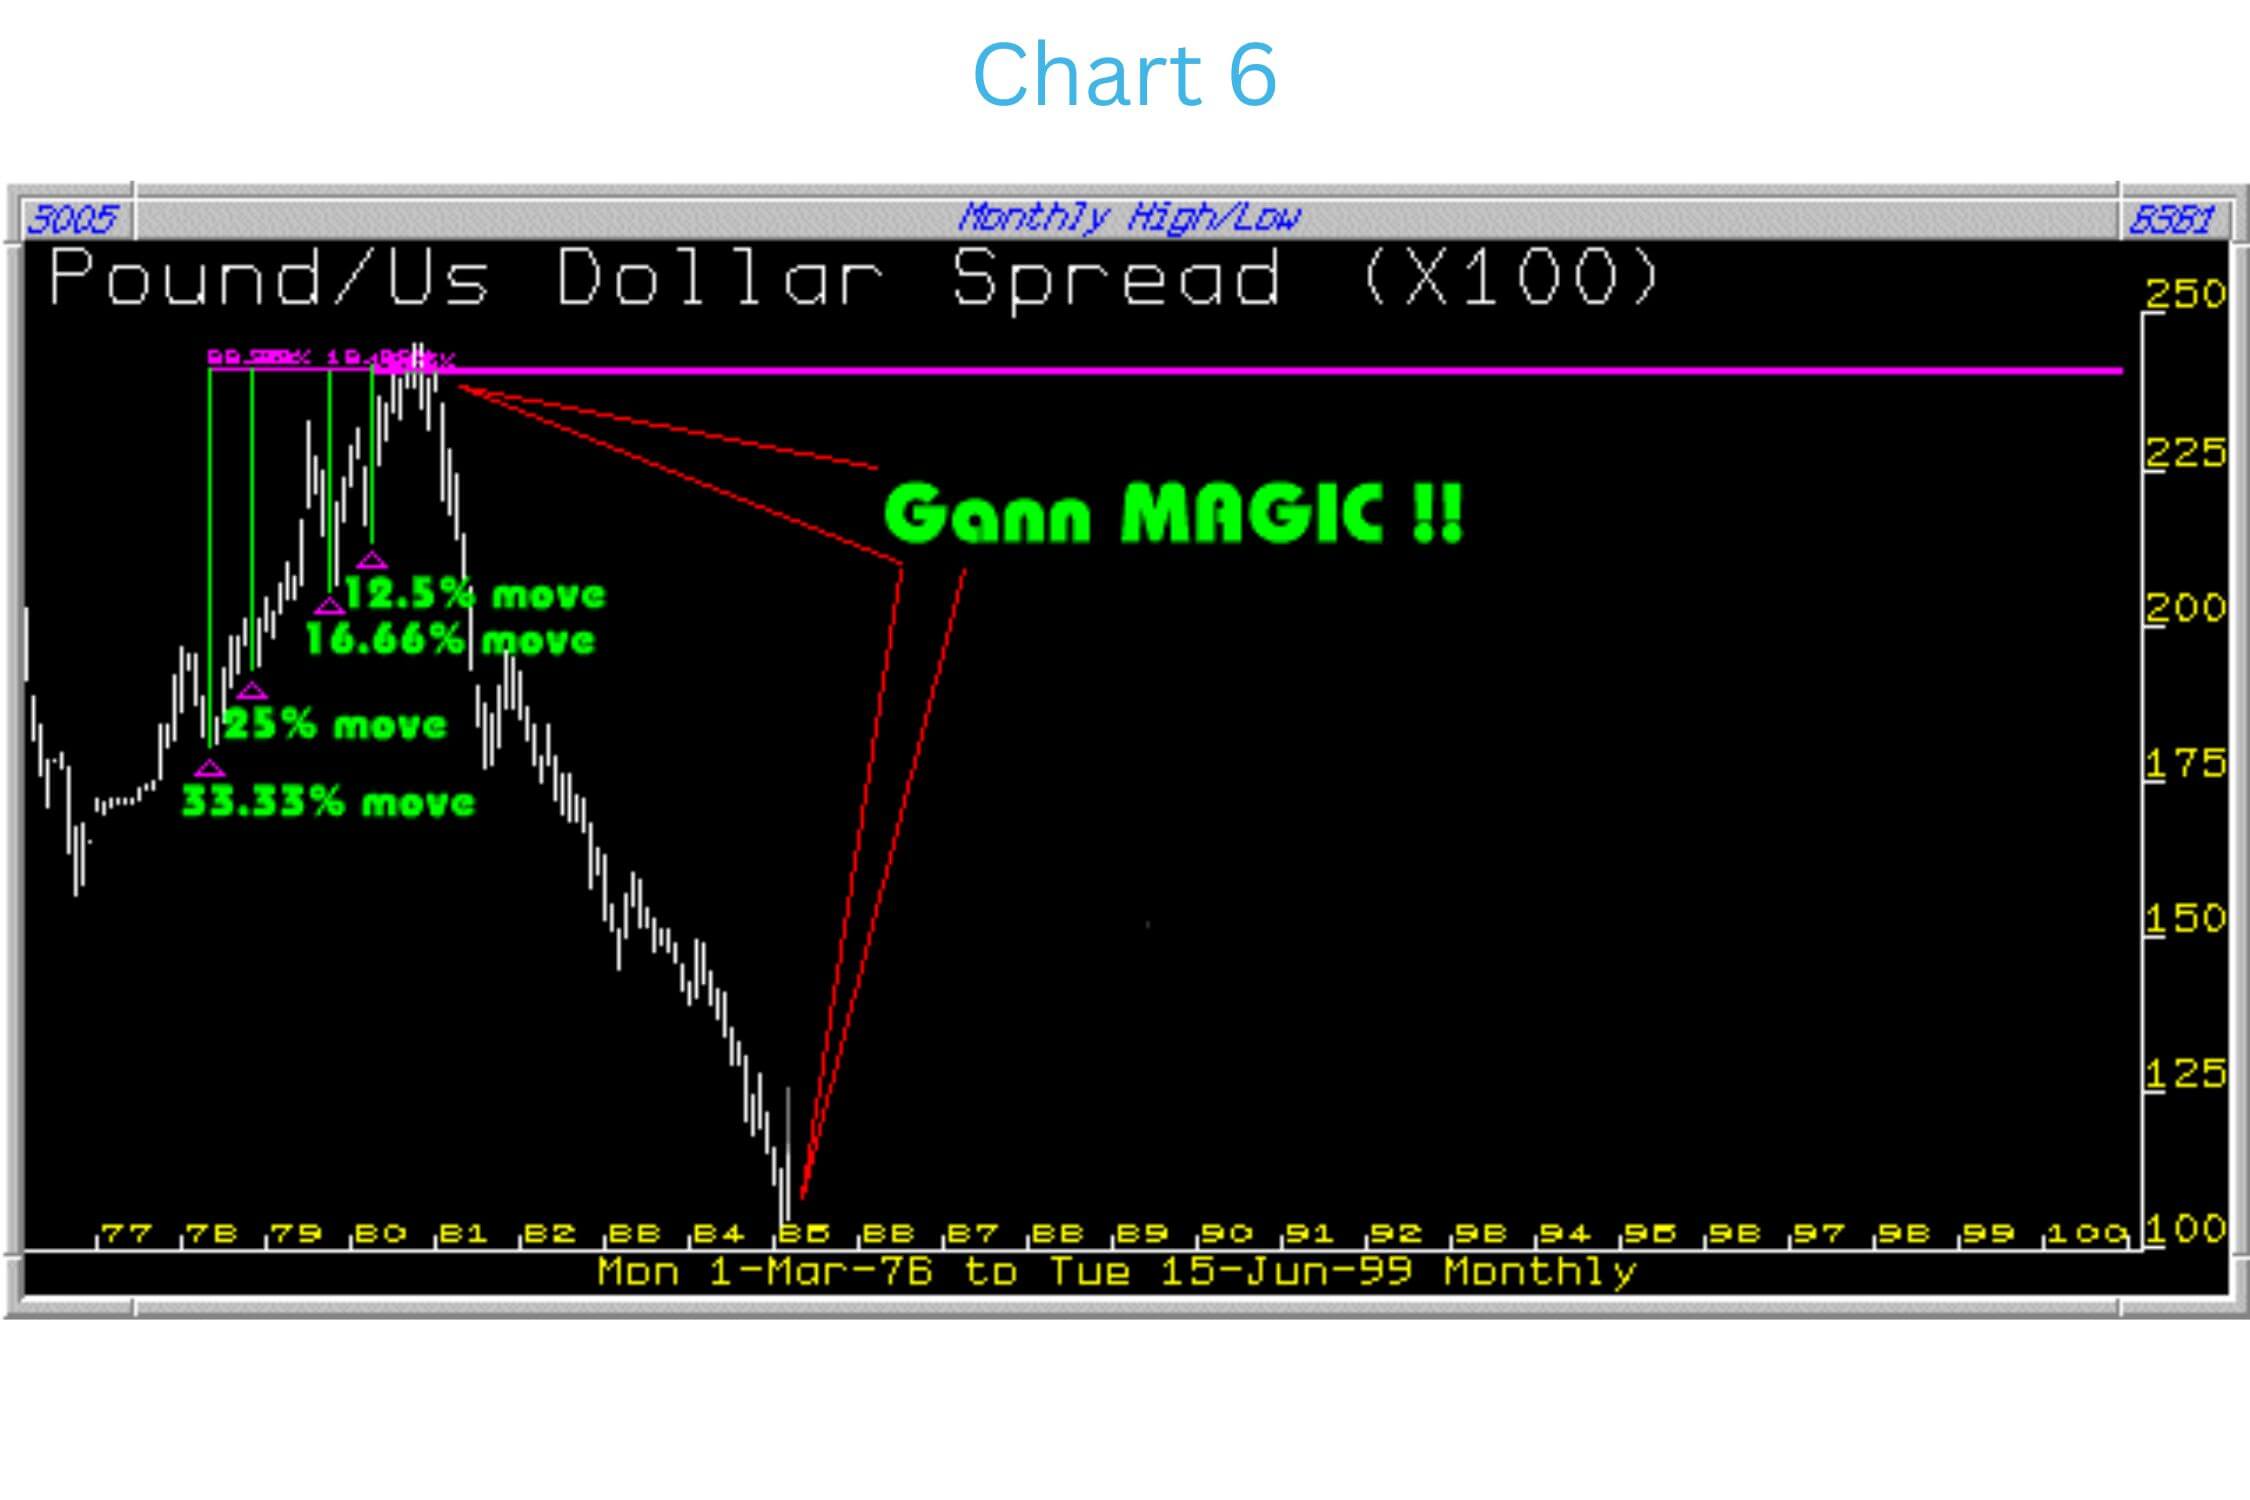
Chart 6 : Voila! Gann Magic.
Chart 7 :
The chart above illustrates how the percentages once again signal an important top. In fact a 'very' important top. This is the Soros Top of 1992 when George Soros took on the British Government as they tried to shadow that monstrosity of all monstrosities the political manoeuverings of the European Union.
As an after thought It is interesting to note that the 1998 high was a top created by 25%, 16.66% and 8.33% - Just another instance of Gann's magical 'Natural Law'.
America Online
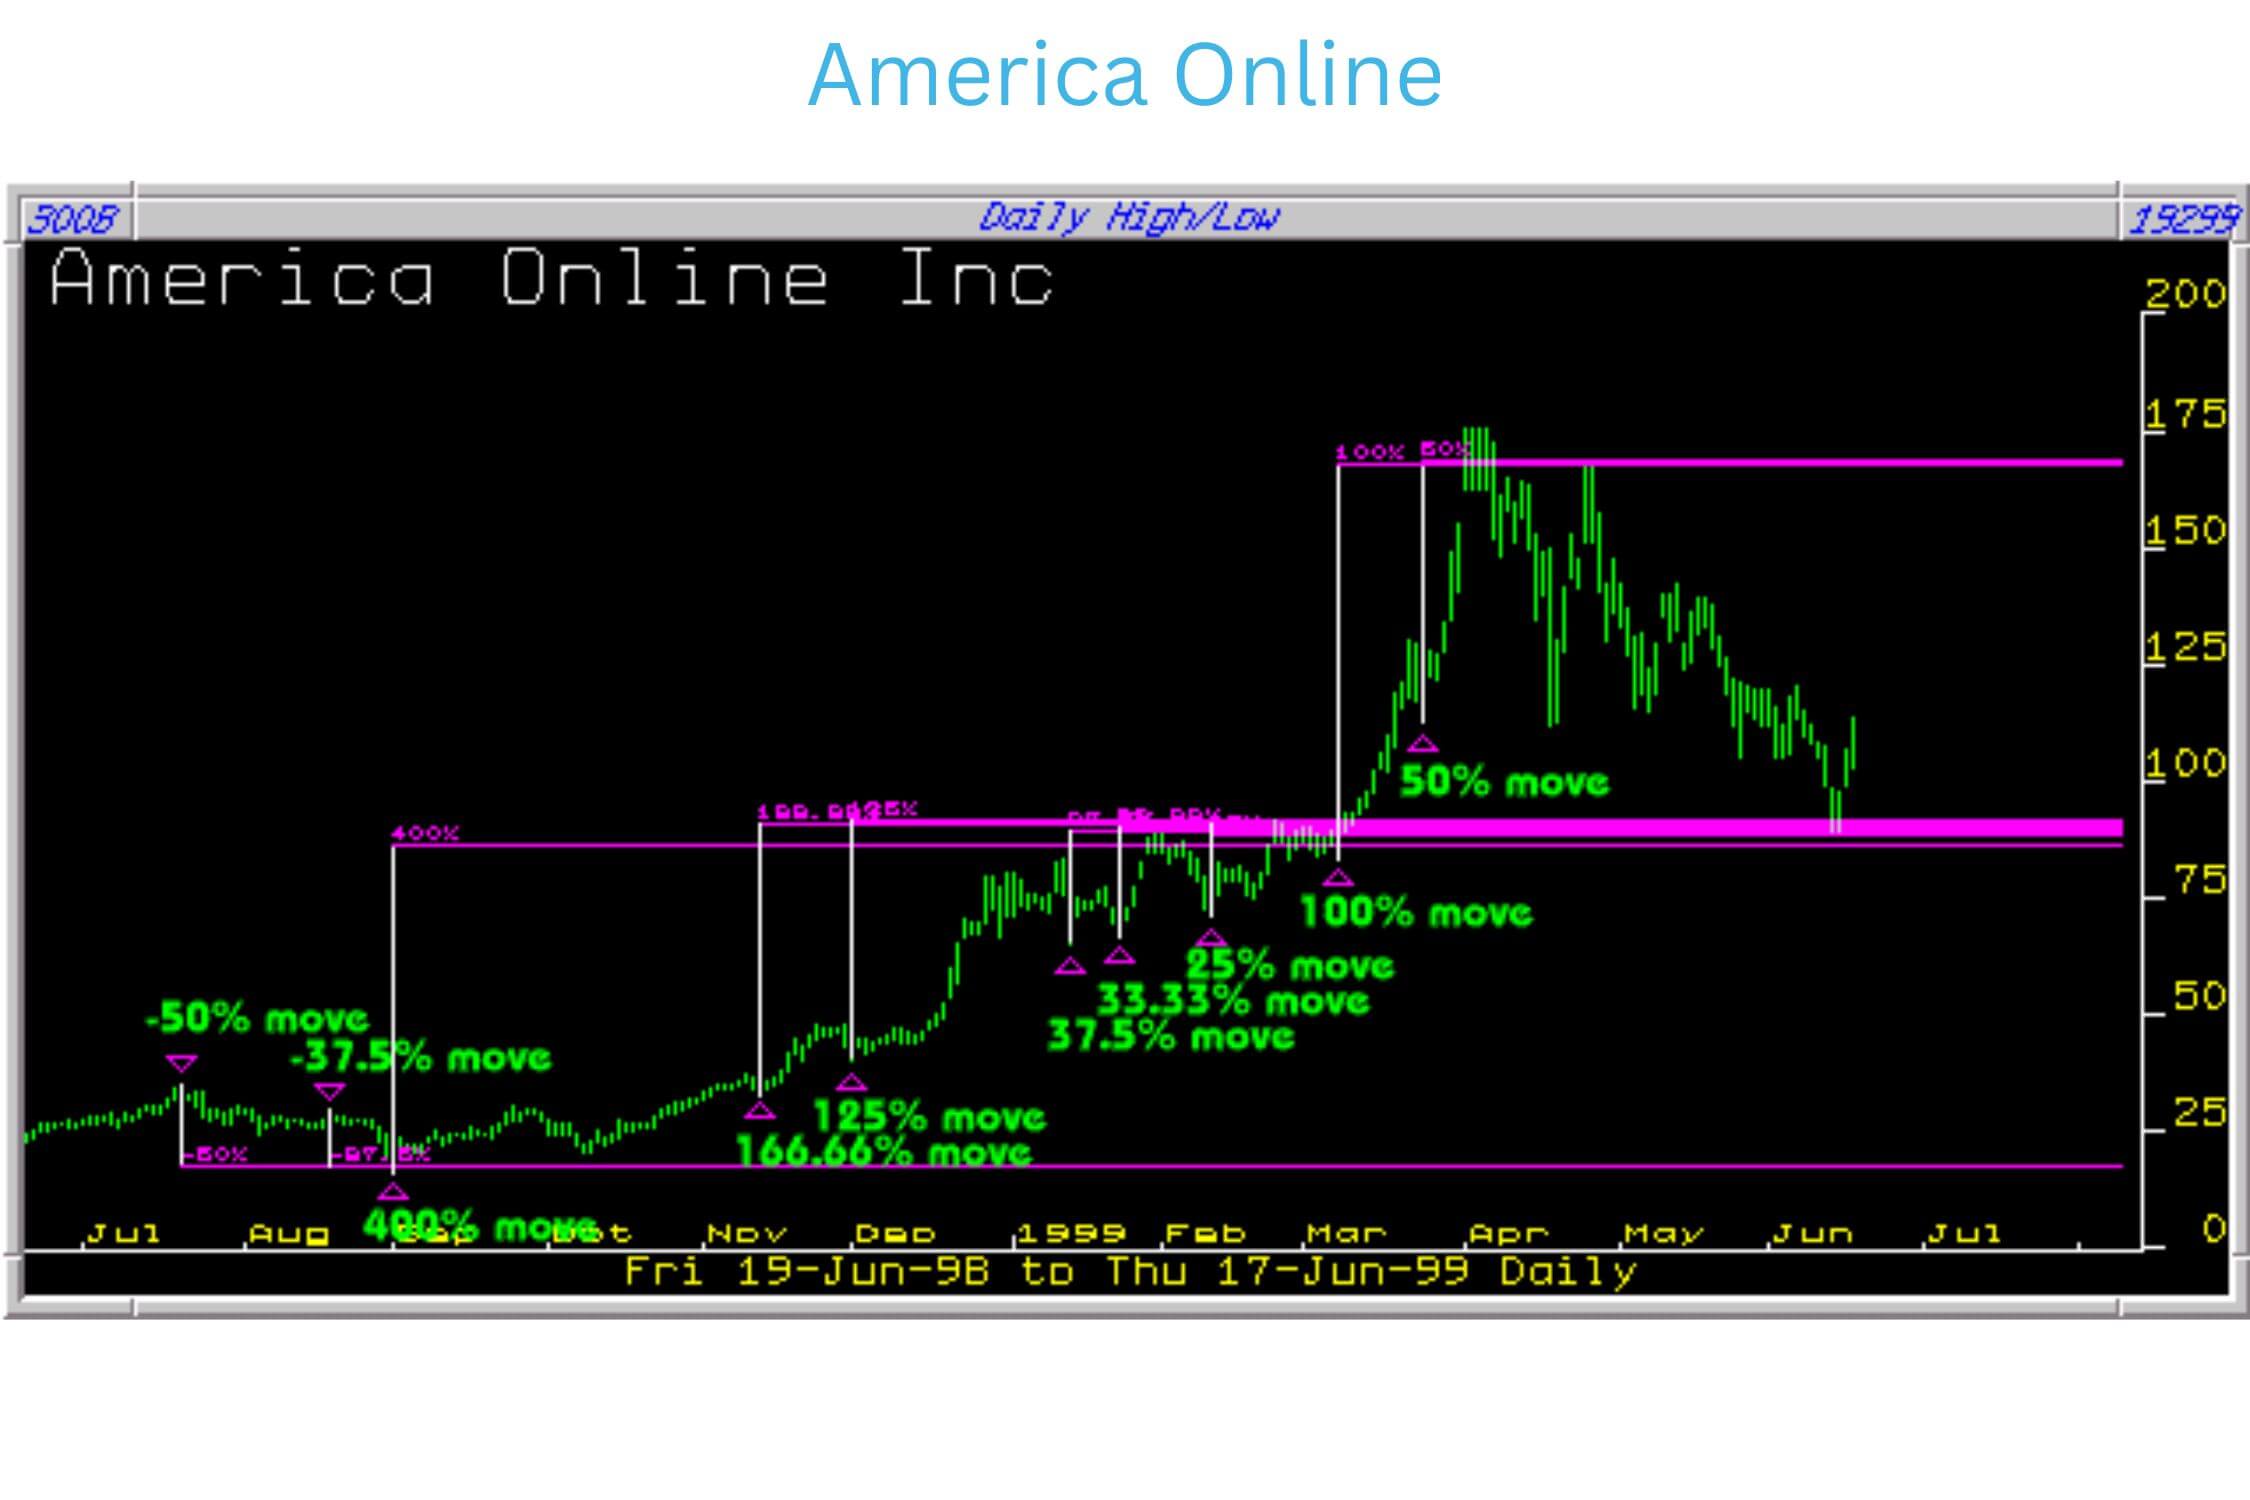
This share has been one of the major successes over the last few years. The chart shows that the low of August 1998 formed on the 50% (G1) level down from the July highs and exactly 37.5% down from the August 1998 highs. The 400% rise was eventually arrested by the following percentages: 166.66% 125% 37.5% 25% After 3 months there was a breakthrough that meant that the rise must reach at least to 155, but more of this in the next lesson. The last high was formed at 100%, 50% and 16.66% and they say trading this share is highly speculative. We call it highly lucrative as it obeys every Gann percentage calculation.
Tellabs
To get in on this 300% move all that was necessary was to apply the following percentages:
1- -66.66& down from the July 1998 high
2- -50% down from the August 1998 high
3- -37.5% down from the September 1998 high
3- -16.66% down from the 06/10/98 high
The S & P 500 Index is a good example of the necessity to adjust a pre-determined 'decision level' as more information became available
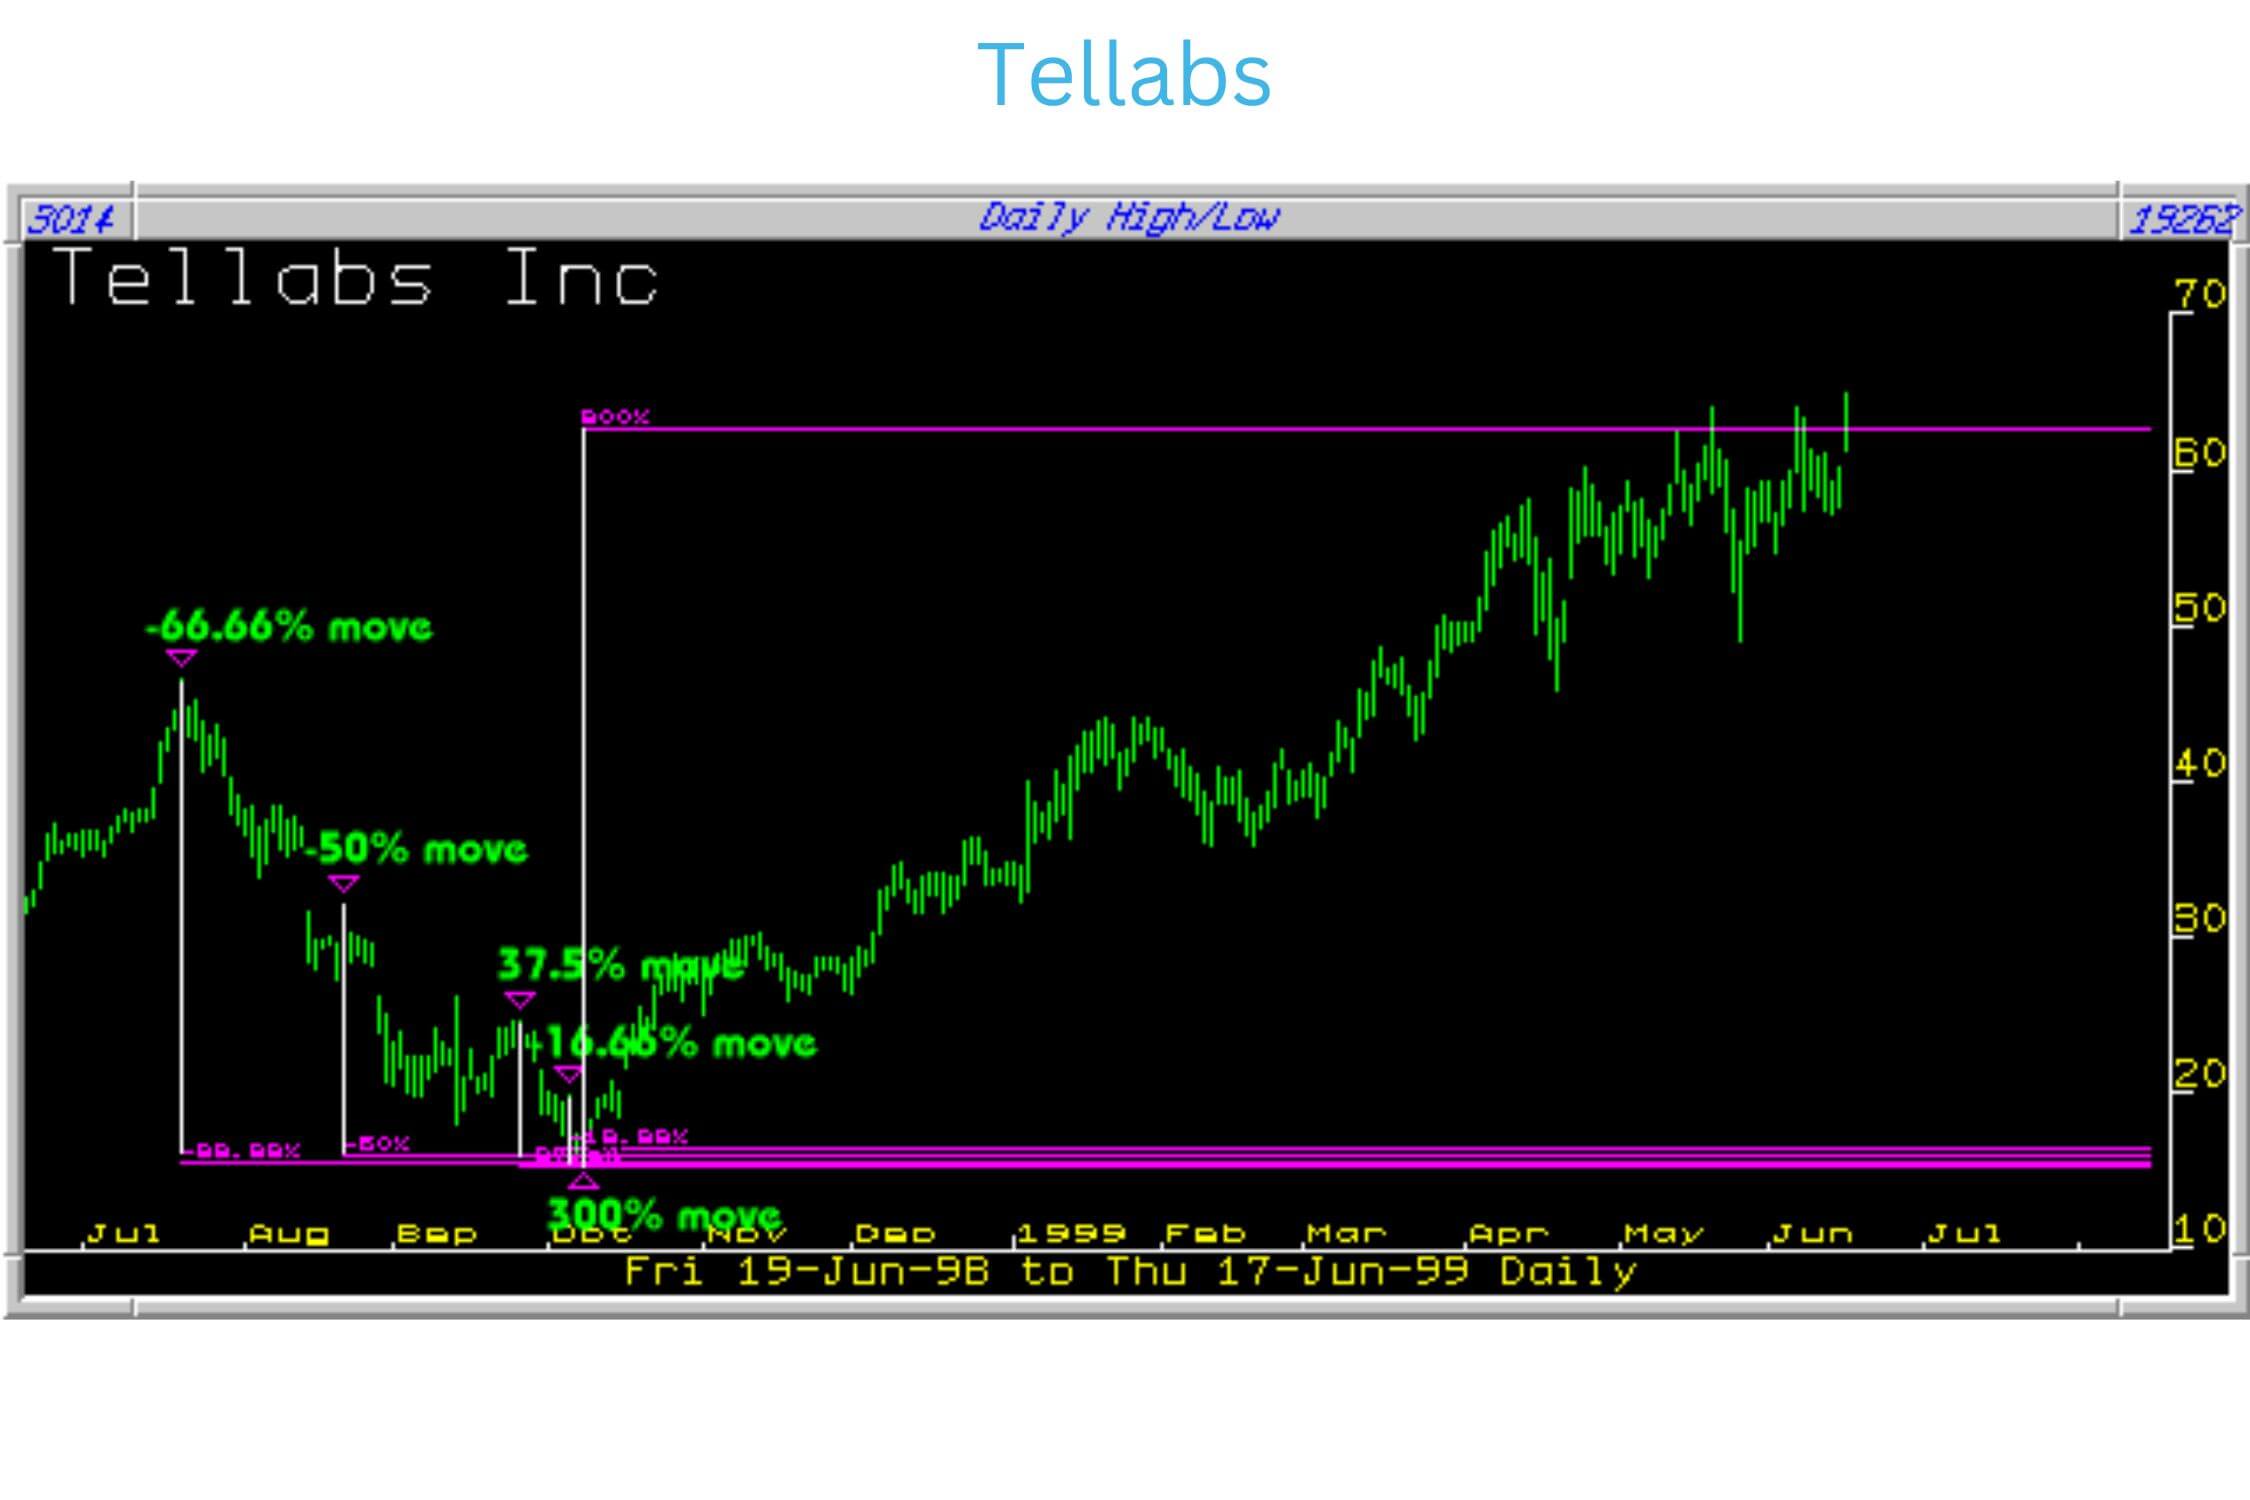
Chart 1
Chart one shows 16.66% and 12.5% taken from the July 1998 highs. This is not a guess but applied as the highs of 1997 are to be found here. The question is will this level be confirmed by percentage calculations down from the short-term tops as they are created. The first assessment suggests that the lows might be formed in the 990 area.
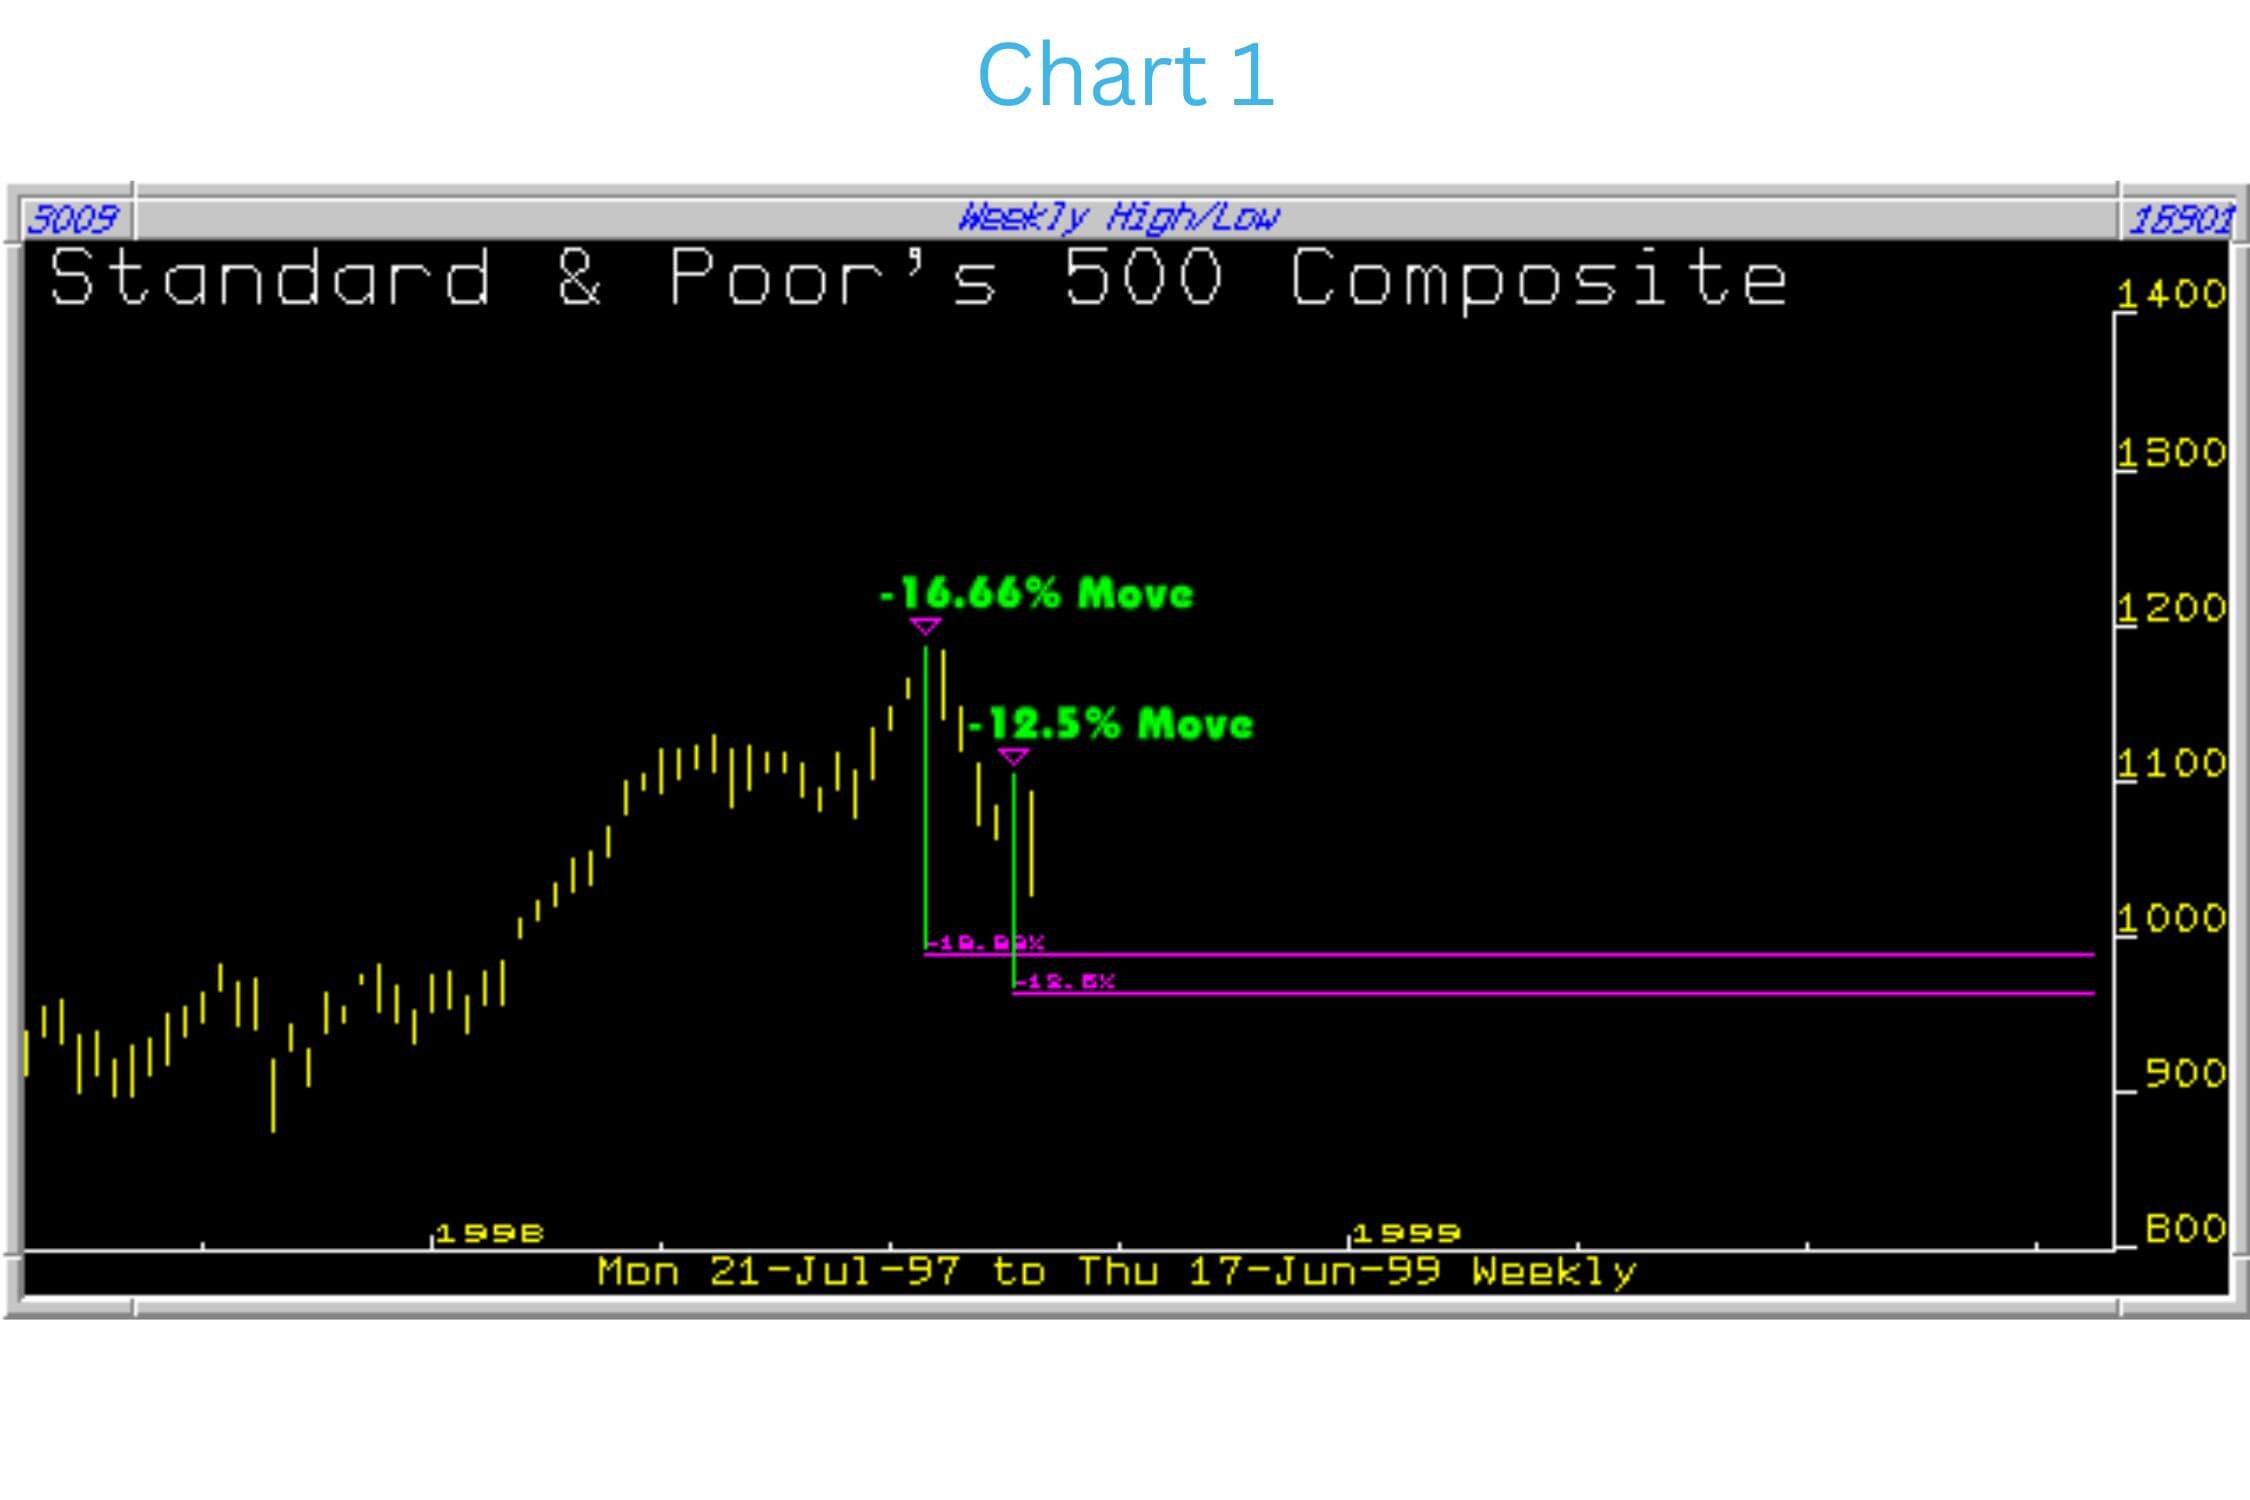
Chart 2
Chart two shows the index having fallen heavily (always the best time to look for a buy when the 'decision level' is close by). Is this at the 'decision level' ? There are three calculations but they are landing some way apart, not very reassuring. This is not confirmation. More work has to be done.
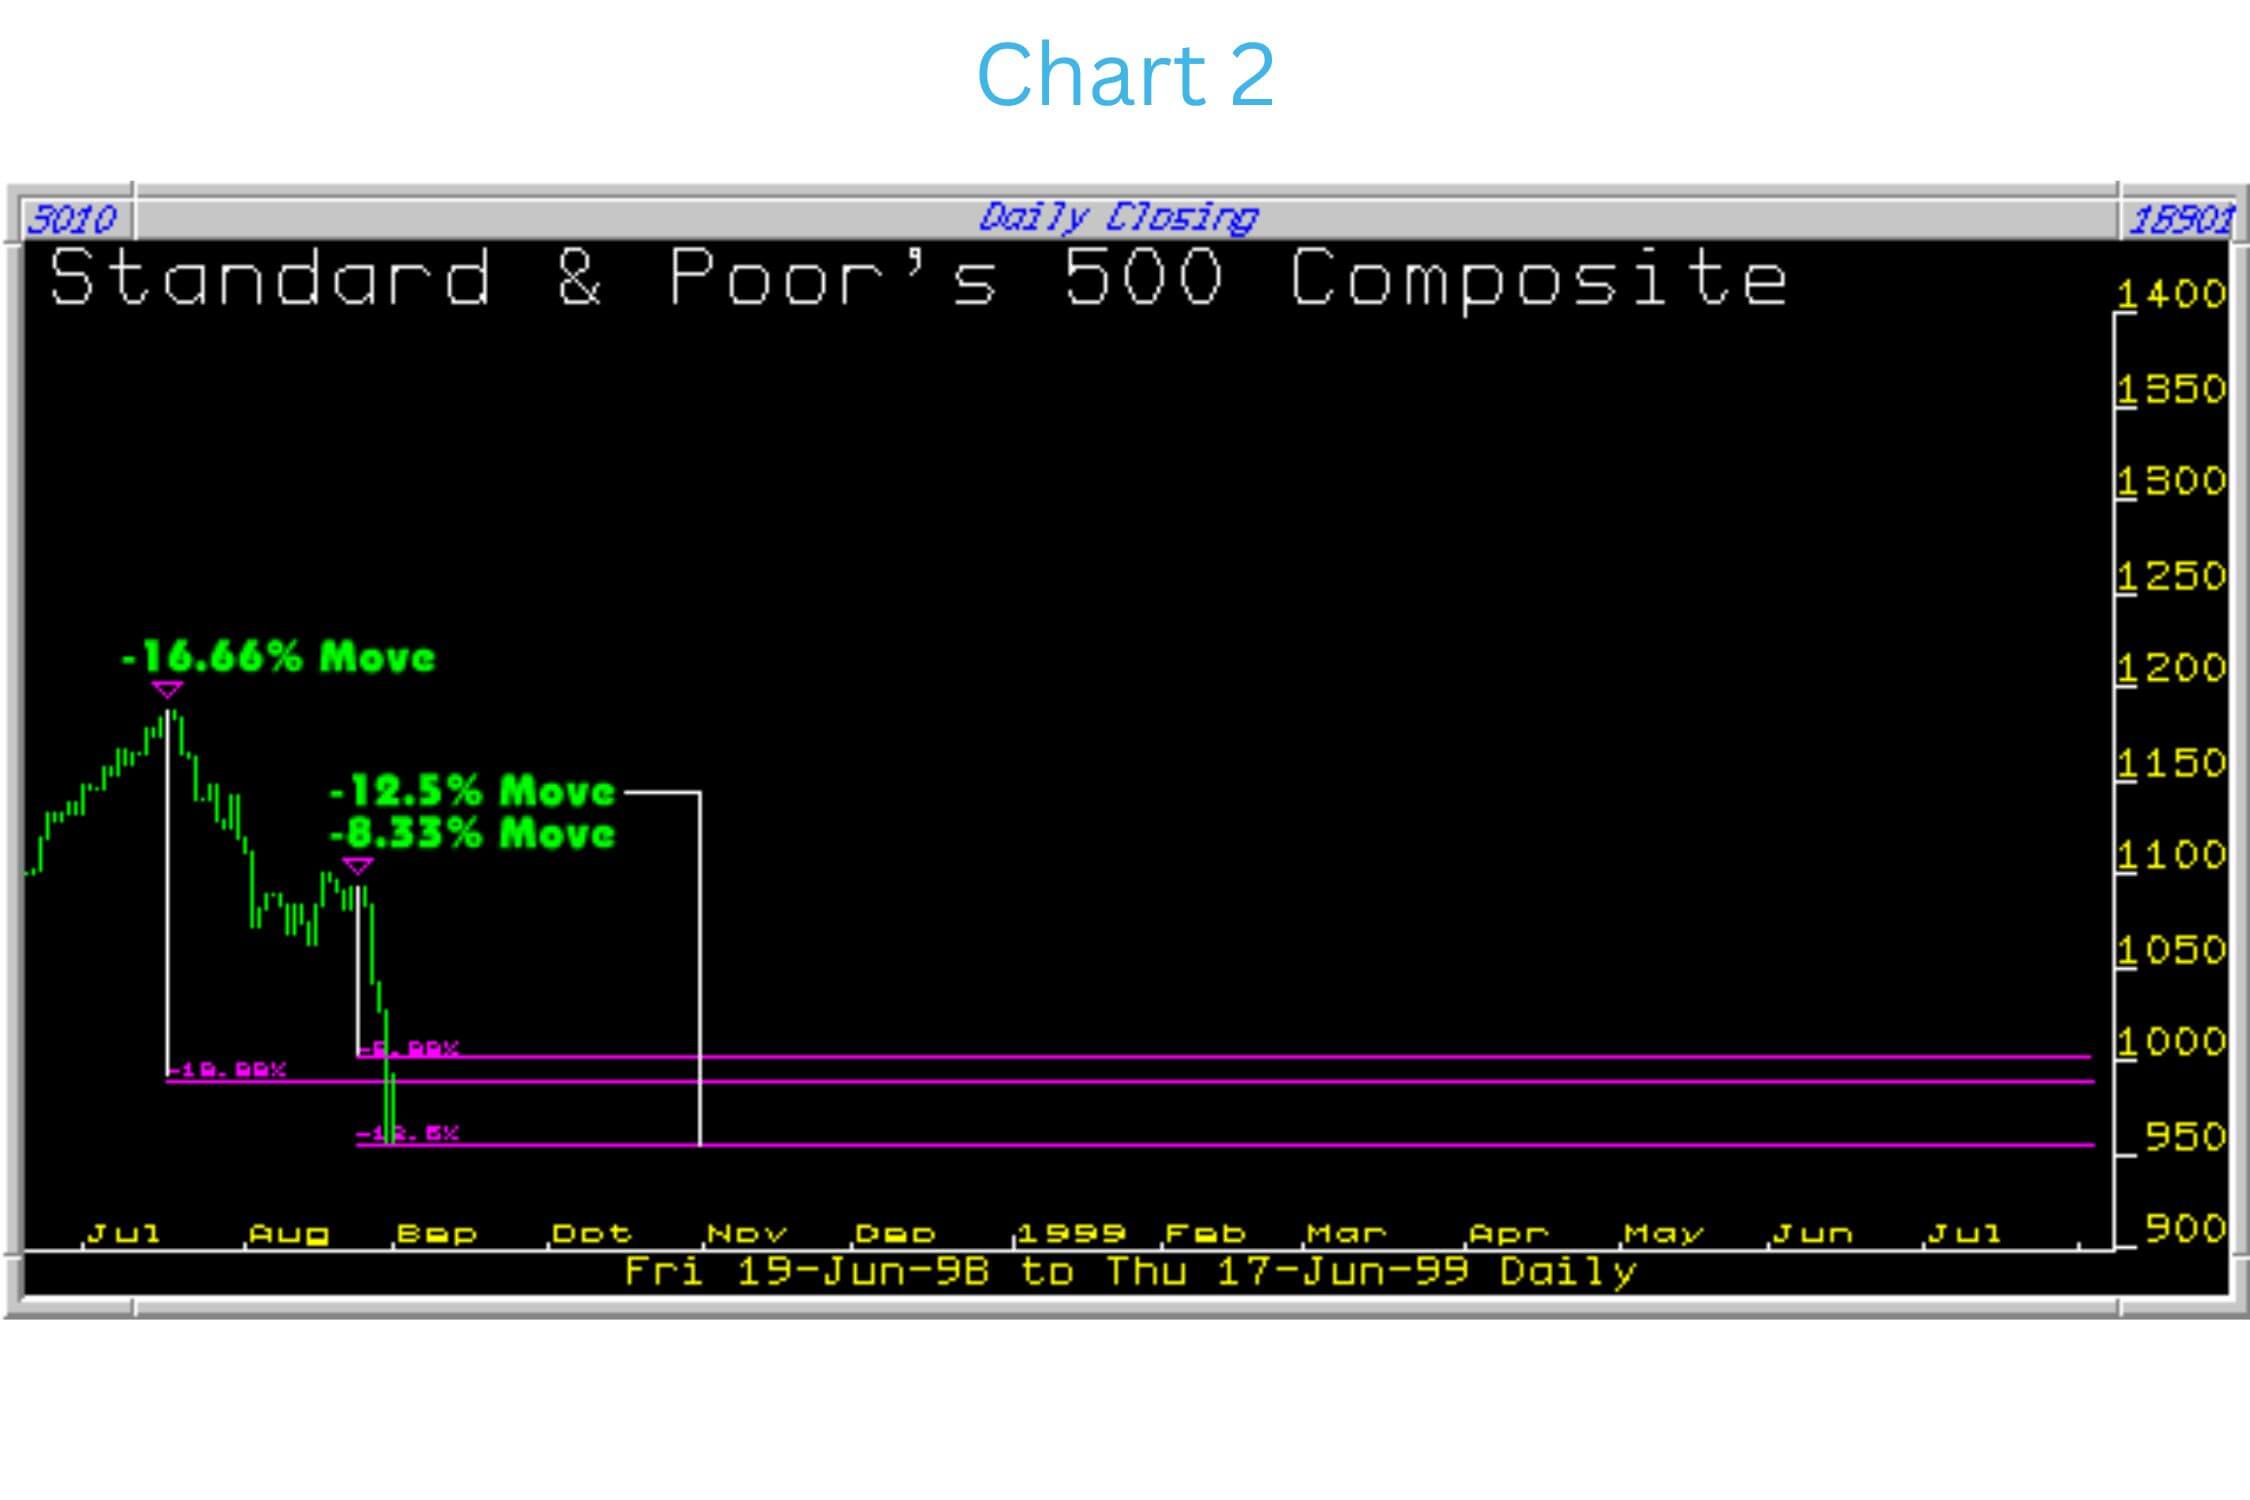
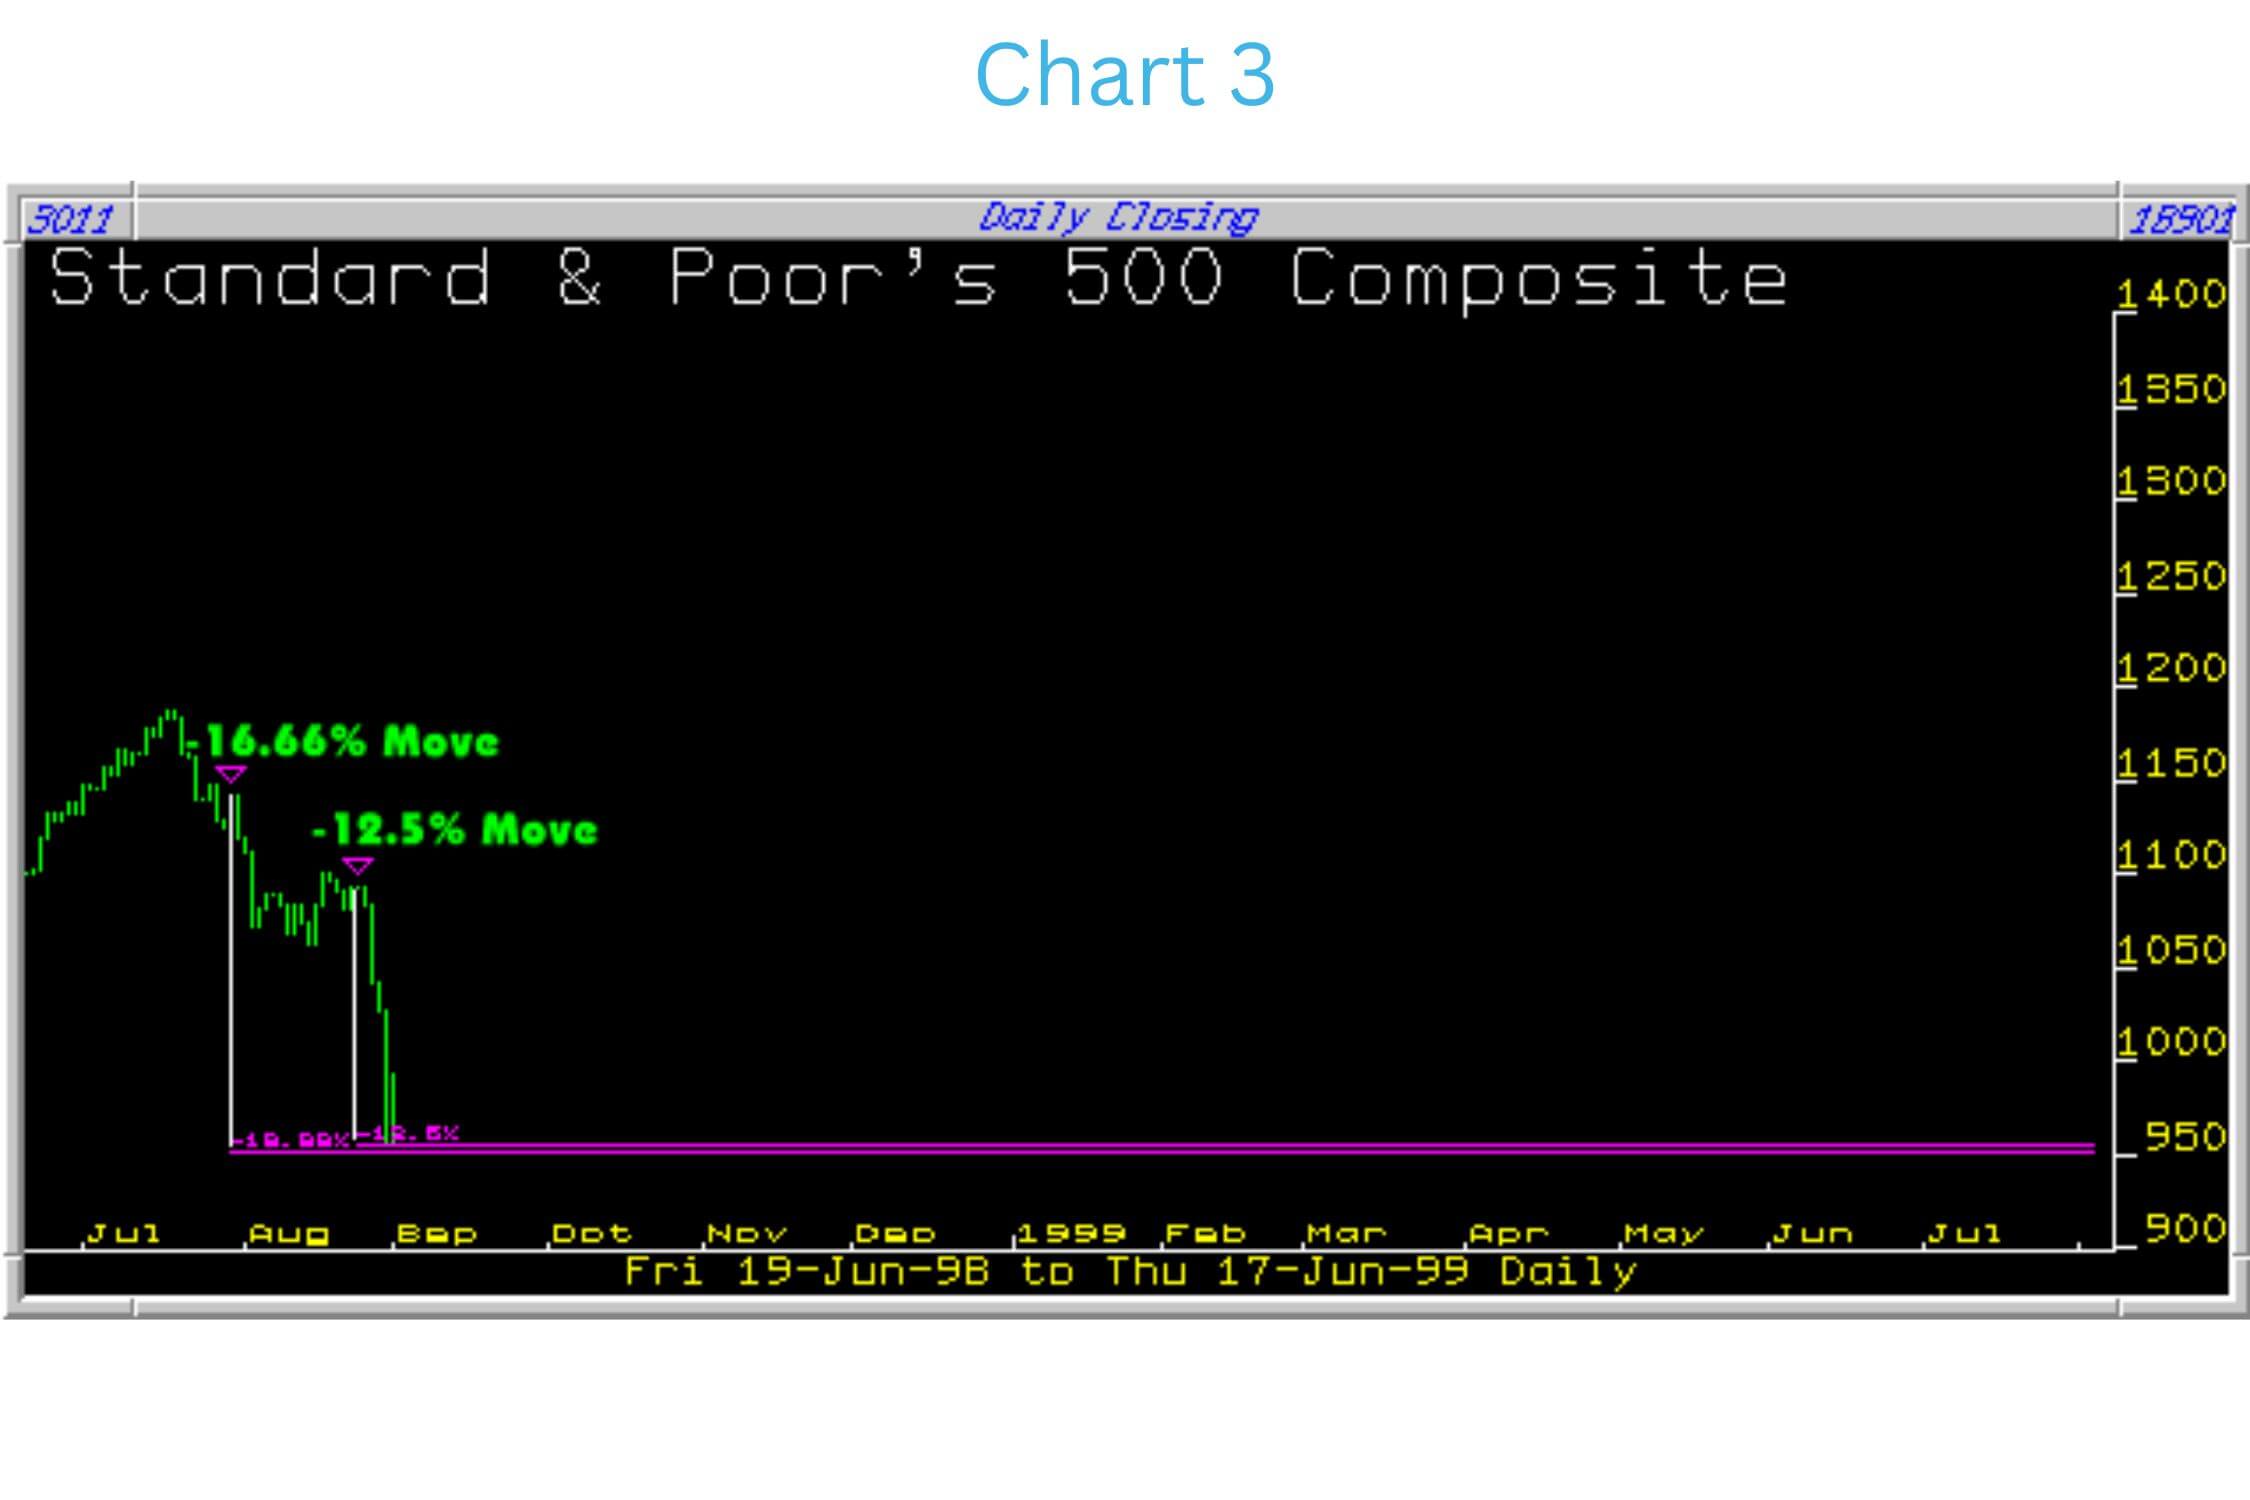
Chart 3
Chart two shows the index having fallen heavily (always the best time to look for a buy when the 'decision level' is close by). Is this at the 'decision level' ? There are three calculations but they are landing some way apart, not very reassuring. This is not confirmation. More work has to be done.
© Copyright 2024 Gann Analytics. Redistribution of this lesson without the author's specific permission is strictly prohibited.

